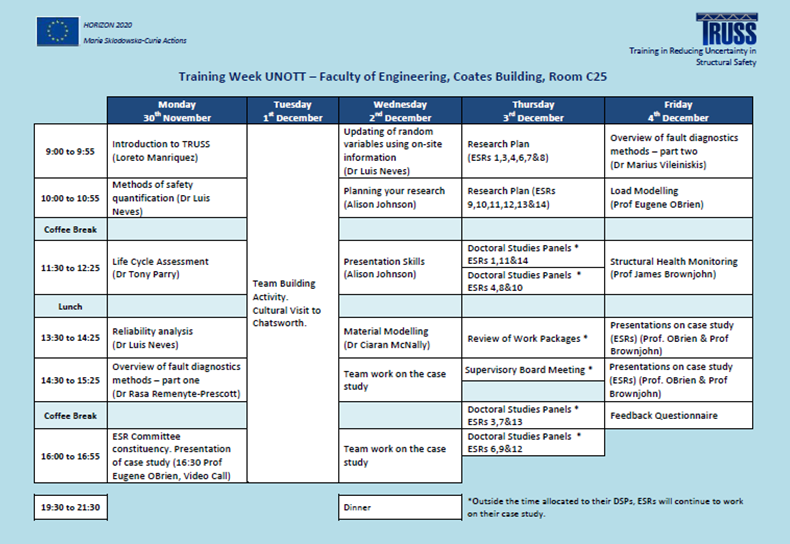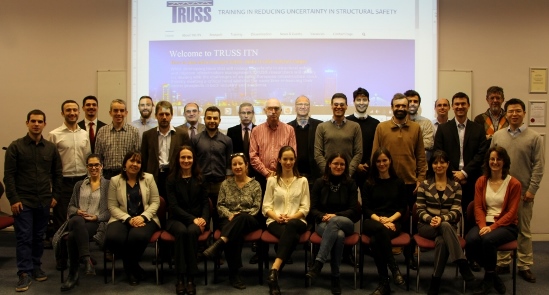

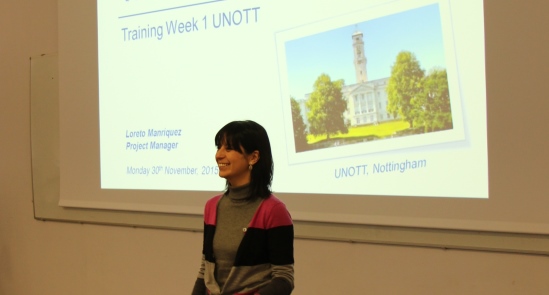
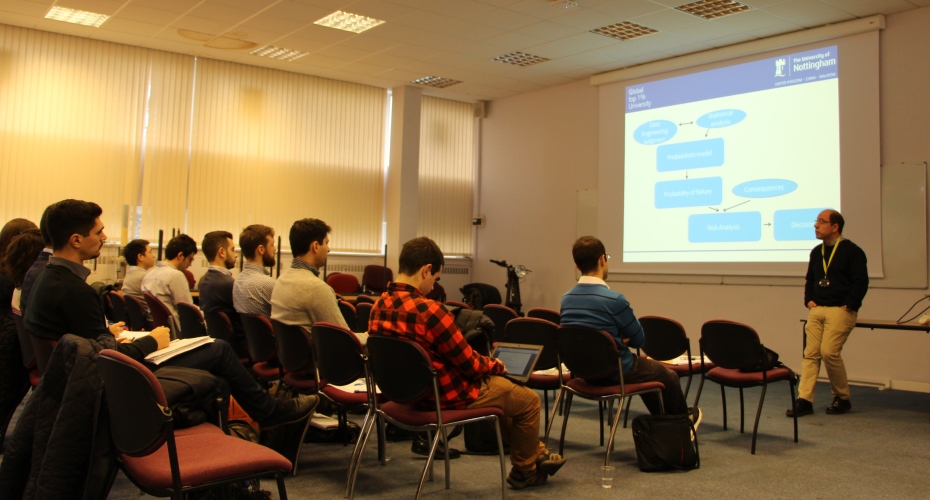
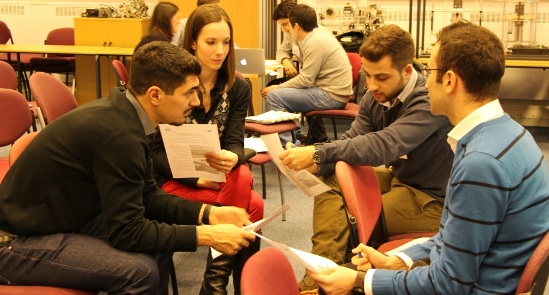


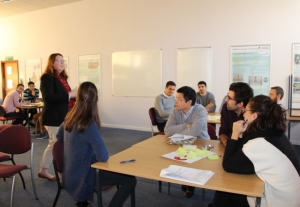
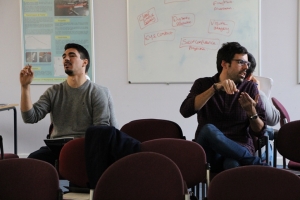
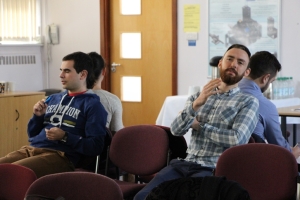
TRUSS first training week was held in University of Nottingham from Monday 30th November to Friday 4th December 2015. The schedule for the week can be found at the bottom of this page. The questions addressed in each module are described in the expandable toggles below.
To give ESRs an overview of the project with emphasis on compliance with the Grant Agreement.
Description
Fellows were given a welcome and had the opportunity to introduce each other. The module included a brief introduction to Horizon 2020 and Marie Sklodowska-Curie ITNs, TRUSS ITN objectives, structure, budget, timeline, means of communication and ESR’s rights and obligations. All TRUSS ITN Work Packages were described. The need to provide inputs for “WP2 – dissemination and outreach” was highlighted (i.e., publications, social media, website, blogs, etc.). A printed copy of the European Charter for Researchers was provided to each ESR.


Core Research Modules
Core research modules provide an overall picture of the structural safety problem, the general theme that encompasses all projects in TRUSS.
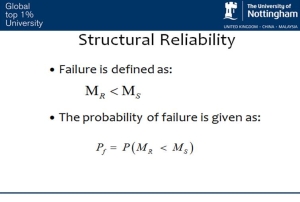
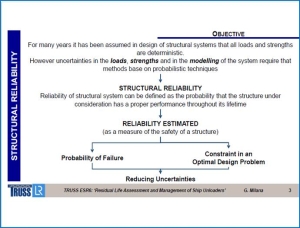
To gather an understanding on the methods to measure/assess safety of a structure, the perfect equilibrium between safety and cost, the methods to compute structural risk, the definition of an acceptable level of risk, the sources of uncertainty in a risk analysis, and how to model uncertainty associated to random variables.
Description
When employing a global safety factor, a single coefficient is employed. However a similar coefficient of safety can result in very different safety levels. When using partial safety factors, a safety coefficient is applied to each variable (each load is multiplied by a different safety factor, and each material and model is divided by a different safety factor). The values of these coefficients depend on the uncertainty associated to each variable. Compared to a global safety factor, partial safety factors lead to a more uniform level of safety across different structures, less unsafe structures and less over designed structures. A third alternative is the use of reliability analysis, which requires more information and it is computationally more expensive but it overcomes most limitations of partial safety factors.
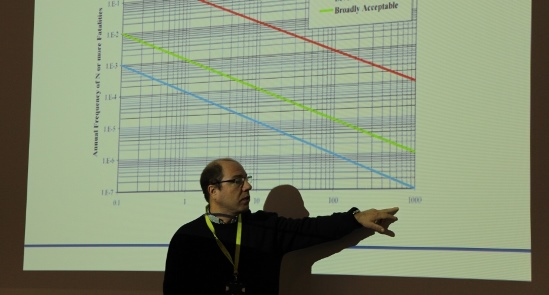
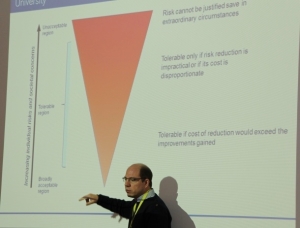
Risk can be defined by the sum of the probability of occurrence of a failure by the consequences/cost. It must be as low as reasonably practicable. The overall costs (risk + mitigation measures) must be minimized. Codes are calibrated to achieve a uniform level of safety depending on the level of consequences of failure.
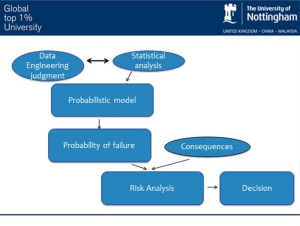
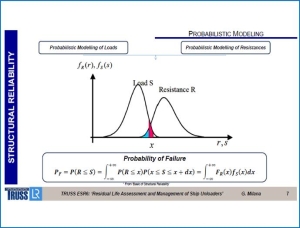
Sources of uncertainty exist in loading, weather conditions, material properties, deterioration, models, costs, etc. They can be classified into aleatory uncertainty, model uncertainty, statistical uncertainty, inherit uncertainty, model and statistical uncertainty. Available data can be subjected to a statistical analysis and used to build a probabilistic model that will be the basis for calculating probability of failure and to carry out a risk analysis that will assist in taking a decision regarding a structure. There is a consistent method to model uncertainty using cumulative density functions and probability density functions. Relevant distributions include normal, log-normal, exponential, gamma, beta and extreme distributions (Gumbel, Frechet, Weibull). Recommendation on best suited distributions for specific loads and material strengths are provided.

To bring awareness of advantages and disadvantages of reliability analysis compared to partial safety factors, and to review the available methods of reliability analysis.
Description
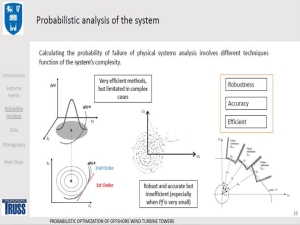
The cost of repairing or replacing some structures is so high that a reliability analysis is justified for a more accurate assessment of structural safety. The method of reliability analysis can be analytical (low computational cost but requires gradient of limit state function), simulation (simple but computationally expensive) or a combination of both. In the simulation method, probability of failure is computed by generating samples of all random variables, and then counting how many lead to failure. The number of samples can be reduced employing an importance sampling technique. The true limit state function can also be replaced by a simpler function. Then First-Order Reliability Method (FORM) or Monte-Carlo are used to evaluate the probability of failure.
Levels of safety assessment are reviewed and examples are provided. They go from Level I (uncertain parameters are modelled by one characteristic value, i.e., Eurocode) to Level IV where the risk is used as a measure of the reliability. In Level II, uncertain parameters are modelled by mean values, standard deviations and correlation coefficients. In Level III, uncertain quantities are modelled by their joint distribution functions.
For existing structures, the cost of increasing safety is very high, and the uncertainty in most parameters and the remaining lifetime is smaller than in a new structure. Since the risk increases with exposure, risks are compared in a common timeframe. Meaning the annual probability of failure should be the same, and short life means smaller lifecycle probabilities of failure.

To understand what a life cycle assessment is and the methodology needed to carry out this assessment.
Description
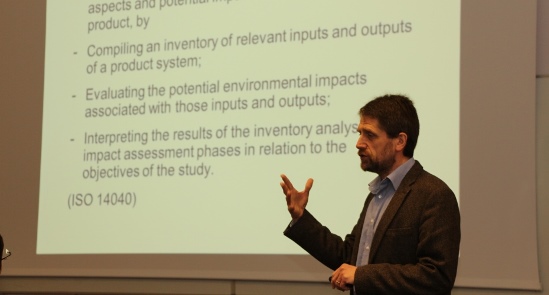
Life Cycle Assessment (LCA) is a technique for assessing the environmental aspects and potential impacts associated with a product over the entire period of its life cycle, by: (a) compiling an inventory of relevant inputs and outputs of a product system; (b) evaluating the potential environmental impacts associated with those inputs and outputs; and (c) interpreting the results of the inventory analysis and impact assessment phases in relation to the objectives of the study.
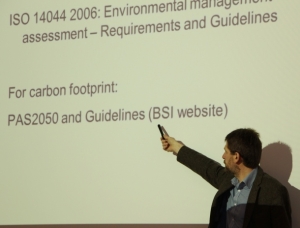
Standards ISO 14040 2006 and ISO 14044 2006 for life cycle assessment and PAS2050 for carbon footprint are reviewed with focus on the steps of the life cycle assessment framework including:
- Goals and scope definition
- Inventory analysis
- Impact assessment
- Interpretation: Identification of significant issues; evaluation by completeness check, sensitivity check, consistency check, other checks; conclusions, limitations and recommendations.
- Direct applications: Product development and improvement; strategic planning; public policy making; marketing; other.

Specialist Research Modules
Specialist research modules focus on specific aspects of quantification of uncertainty in structural safety. Contents include how to model random variables, and those specific to materials and loads. Also, how to identify damage from measurements in an existing structure or how to monitor structural health and performance on a continuous basis
To identify the differences between new and existing structures regarding safety, to be able to judge if a structure with a specific degree of deterioration can remain opened for use or needs to be closed, to be able to use Bayesian updating to define variables and a reliability index more accurately.
Description
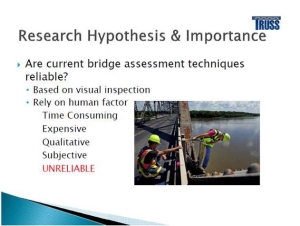
When analysing an existing structure, information unavailable in the design phase can be obtained via non-destructive testing, proof loading tests and inspections. According to the level of assessment, there are strength and load models, calculation models and assessment methodologies that vary in complexity. The presence of damage means that the strength of the structure is lower than initially estimated, and as a result, it does not comply with the code anymore. Numerical examples of the cost of providing additional strength in the design phase or to an existing structure are used to illustrate the points above.
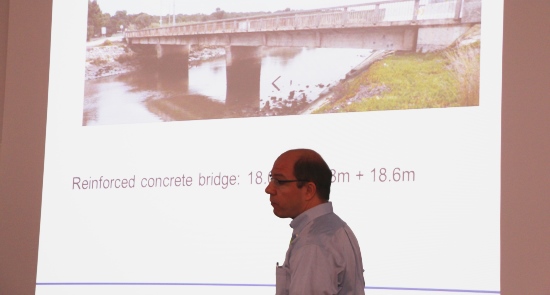
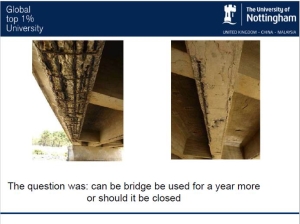
A practical case where it is needed to decide if a bridge can remained opened (or not) to traffic for one year more, is presented. When applying a code based assessment, the bending moment strength shows to be insufficient. Using FORM analysis, the reliability index is below the acceptable threshold, and consequently, the bridge should be closed. Bayesian updating is then used to carry out a more accurate assessment of structural safety. In the process, new distributions of concrete strength are updated based on tests. Although in some simple cases, expressions for the final (posterior distribution) can be derived, some sort of simulation must typically be used. Finally, the Bayesian updating algorithm leads to a reliability index higher than the acceptable threshold, i.e., the structure is found to be safe.

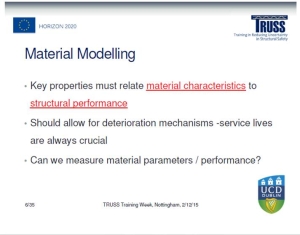
To understand the characteristics of the material we need to be interested in, how it relates to performance, and how we can measure and model material parameters/performance. To know how to allow for deterioration mechanisms into the material performance.
Description
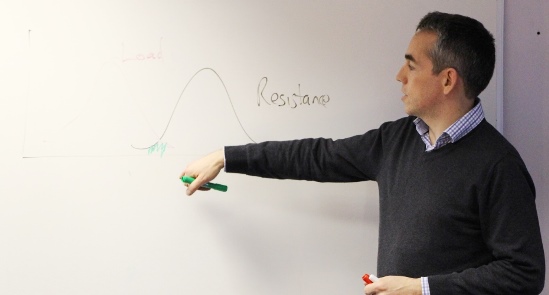
The tail of the resistance curve is very important when establishing if the structure is safe. The latter is a function of materials, geometry and time. The following materials and key properties are found in TRUSS projects:
- Reinforced concrete: Corrosion, strength
- Steel: Corrosion, fatigue
- FRP: High strength, brittle
- Asphalt: Viscoelastic, surface damage
The key properties above must relate material characteristics to structural performance, and deterioration mechanisms should be allowed. Dynamic, mechanical, deterioration-based, electrochemical, fatigue, visual, NDT and geophysics field/lab tests are employed in calibrating these material models. Questions to address in this modelling are: Do you have S-N curves for characterizing fatigue? How variable are corrosion rates? How to characterise a brittle material (i.e., FRP)? What NDT methods to use for concrete?
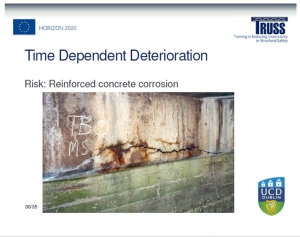
The time dependant deterioration is specific to each material and deterioration mechanism. Corrosion is discussed as an example of deterioration mechanism. The requirements for corrosion to proceed are explained. Steel is resistant to corrosion when encased in concrete due to the formation of a passive film on the steel surface. For corrosion to occur, this passive film must first be destroyed. The most common cause of corrosion in concrete is chloride ingress. Chlorides enter concrete through a combination of transport mechanisms, including diffusion, absorption and capillary action, with diffusion being the most common transport method. When the chloride ions reach the steel they disrupt the passive layer protecting the steel, the passive layer can be destroyed and corrosion initiated if the chloride concentration was high enough. The latter is the first phase of the corrosion process, i.e., initiation. A second phase is propagation with unchecked continuation of corrosion
Standard highway maintenance practice is to apply de-icing salts to pavements in cold weather. When these salts are applied over a bridge, they dissolve in water to form a chloride rich solution that permeates through the bituminous surface and gathers over the bridge deck. The other main source of chlorides is marine environments. The chloride profile within a bridge can be measured in the field at any given time.
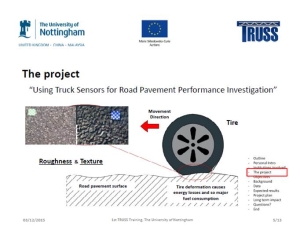
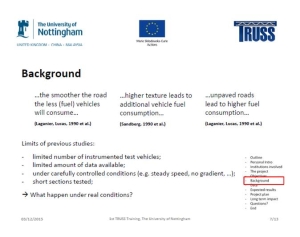
To establish the worst load combination for a given return period, to determine and calibrate load models and to calculate the characteristic load effect (i.e., structural response for a given level of safety).
Description
Load modelling is discussed using traffic loading on bridges as example. Bridge loading in new bridges is designed for a notional load model specified in the Code of Practice. The notional loading represents worst possible combination of “normal” trucks. This is a very conservative traffic load model that provides for future growth in freight traffic.
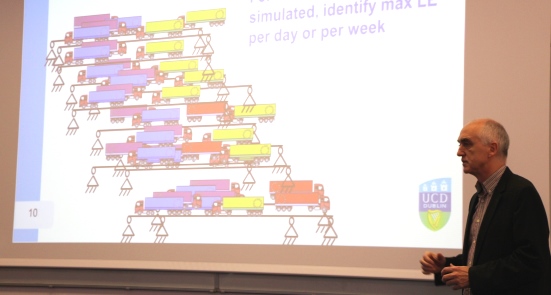
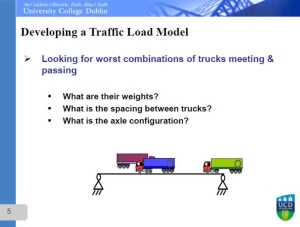
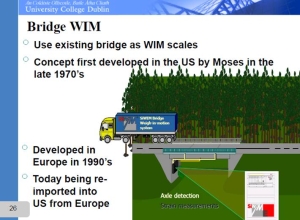
Bridge loading in existing bridges need to be much more realistic to avoid premature strengthening or replacement. Hence, site-specific load models can save lots of money. To develop a traffic load model, it is necessary to collect data on truck weights, frequency of heavy trucks, statistics on gaps between trucks, and on axle spacings, etc (i.e., via a weigh-in-motion system). Having gathered truck weight statistics, Monte Carlo Simulation can be used then to generate typical weights of trucks on a bridge, typical axle spacings, typical weights per axle, etc.
The weights are then converted to load effects such as bending moment at a section, shear force, reaction at support, etc. For each truck scenario, the static load effect can be calculated combining loads and influence lines for the load effect under consideration. This is repeated many times (using bootstrap, parametric or semi-parametric fits to measurements). Decades of loading events are generated, and for each day or week simulated, the maximum load effect per day or per week is identified. Then, it is possible to fit a statistical distribution (i.e., Cumulative Distribution Function (CDF)) to the maximum load effects and extrapolate the load effect for an acceptable level of safety, i.e., 1 in 1000 years (known as characteristic static load effect). Fit of CDF to data tends to be very inaccurate in tail region, but probability paper plot rescales the vertical axis, making it linear and more suitable for finding characteristic values. There are three families of statistical extreme value distributions typically used for compliance with available data and extrapolation: Gumbel, Weibull and Frechet.
Finally, a dynamic amplification factor is applied to the characteristic static load effect to estimate the characteristic total load effect. If a notional load model is developed for an entire road network (as opposed to a single bridge), the characteristic total load effects need to be found for a range of spans, bridge types and load effects. The notional load model would have to give approximately the same load effects as the characteristic total load effects. If probability of failure was sought, it is needed to combine a probability distribution for resistance with the distributions of load effect to get the probability of load effect exceeding resistance.
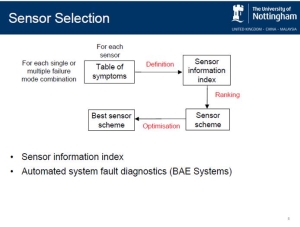
To understand the aim and benefit of fault diagnostic methods and the use of Bayesian Belief Networks (BBNs) for identifying faults and its causes in a structure.
Description
The aim of system fault diagnosis is to recognise when a fault exists on a system and to identify its causes for reducing system unavailability and increasing system safety.
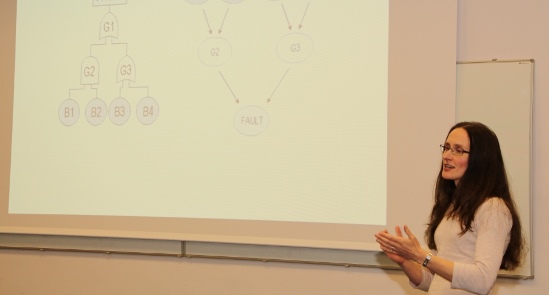
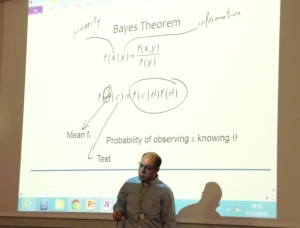
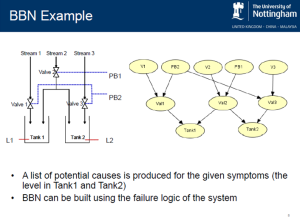
BBNs are probabilistic graphical models ideally suited for modelling the causal relations between faults and symptoms. The prior (initial) probability of an event can be updated following an observation (evidence) about the system state. The posterior (updated) probability of component failures is a measure of which components have caused the observed symptoms.
BBNs can model the uncertainty of relationships among random variables using the failure logic of the system. They consist of nodes, representing variables of interest (e.g. the occurrence of an event or a system component), and links joining the nodes, representing causal relations among the variables. Nodes can be root (without a parent node) or child. The probabilities of a root node being in each state is given by prior probabilities. The probability of any child node is calculated (1) using the law of total probability; (2) applying the chain rule to express each term using conditional probabilities; (3) simplifying each term according to the connections within the BBN, and (4) taking the probabilities from Conditional Probability Tables (CPTs). Node probability can be then updated using the Bayes’ theorem.
Examples are provided to illustrate how BBNs are implemented for fault diagnosis. The steps include the probability update of each root node as per above, followed by the calculation of the probability of ‘true’ state of each root node with evidence about the state of a child node, usually fault occurrence. If the root node was not related to the node with evidence, its prior probability does not change, therefore, the calculations for that root node can be omitted. Finally, the probability of an individual component causing system failure can be used to rank the causes.
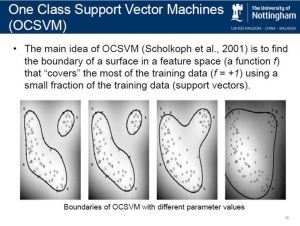
To understand the application of One Class Support Vector Machines for identifying faults prior to failure.
Description
The aim of “fault diagnostic techniques – data based” is to identify deteriorating conditions prior to failure. Here, fault detection is treated as a classification problem. This lecture is focused on the data drive method known as One Class Support Vector Machines (OCSVM).
In terms of system fault detection, OCSVM is trained to learn the behaviour of a system under normal conditions to identify abnormal behaviour of the system. Trained OCSVM is used to classify the new data as falling into either normal (system with no failures) or abnormal class (system with a failure present). OCSVM is used to identify a highly represented class in order to detect a small amount of abnormalities.
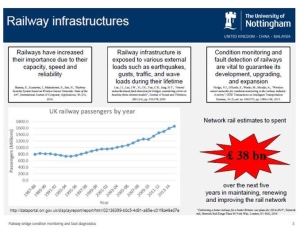
The main idea of OCSVM is to find the boundary of a surface in a feature space that “covers” the most of the training data using a small fraction of the training data (support vectors). Current applications of OCSVM are reviewed and a real-case application to railway point machines (Network Rail) is used to explain the implementation of OCSVM to identify faults. The benefits are to reduce disruptions and to increase safety in railway networks moving towards preventive (instead of corrective) maintenance and a more convenient scheduling of maintenance works.
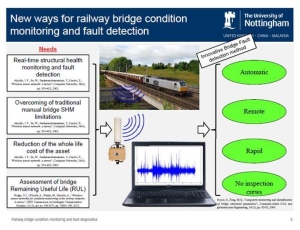
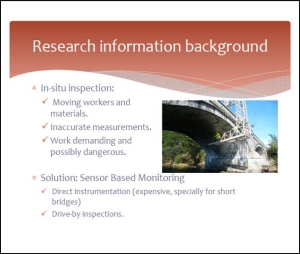
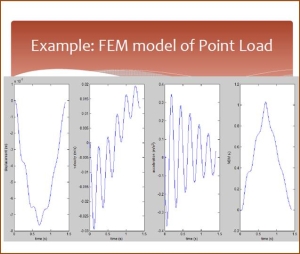
To understand what Structural Health is, the origin and evolution of Structural Health Monitoring (SHM) systems and the requisites of a SHM system (diagnosis and prognosis). Also, to become aware of Structural Identification technologies and what the future brings for SHM systems.
Description
SHM is a continuous identification of a physical or parametric model of a structure using time-dependent data. The signals used in SHM are derived not only from vibrations, and it’s not all about detecting damage.
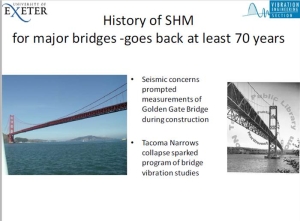
The start of Civil SHM can be related to the Dale Dyke dam failure in 1864 (Sheffield, UK) that led to The Reservoir Act, which gives a supervising engineer legal responsibility for continual surveillance including keeping and interpretation of operational data. History of SHM for major bridges goes back at least 70 years as a result of seismic concerns (I.e., measurements at Golden Gate Bridge). A program of bridge vibration studies followed the Tacoma Narrows collapse. In offshore structures, civil SHM is mostly focused on piles.
While automotive and aerospace industries feature health/performance monitoring with real-time diagnosis to provide condition-based maintenance and/or immediate decision support avoiding the need for costly inspections, SHM challenges with civil infrastructure are actually greater with each structure being a prototype. Civil SHM seeks both diagnosis (Prove structural fitness for purpose; check novel systems of construction/structural forms; validate structural modifications & mitigation measures; track structural loads/overloads/extreme responses; evaluate ’serviceability’; provide a feedback loop to design and loading codes; detect ’damage’?) and prognosis (Assess structural safety after trauma; track long term degradation to aid maintenance decisions; provide warning of impending failure?).
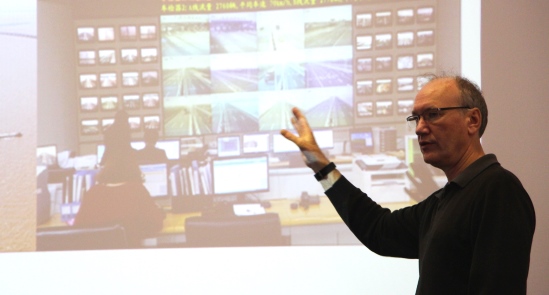
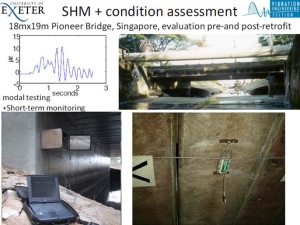
Civil SHM comprises automated, on-line elements (Long term monitoring – sensors and data -) and user-driven, usually off-line elements (Condition assessment – testing and model validation/updating -). A number of active SHM systems are reviewed including Maentwrog Dam (North Wales), Tsing Ma, Hong Kong (Fugro), Donghai Bridge, China (National Instruments), Rion Antirion Bridge, Greece (Advitam) and Humber bridge (UK). Structural identification technologies with updated FE modelling are also explained using the Tamar bridge (UK) as example. It is seen how data-driven SHM detects subtle performance anomalies via mathematical time series analysis series of response parameters. Finally, vision systems in the Humber and Tamar bridges are discussed, and the following question is posed: “Measuring without sensors?”
Communication/Transferable Skills Modules
Transferable/Communication modules provided fellows with a clear idea on how to build a research plan, and how to improve their presentation skills towards their first public appearances with TRUSS.
To encourage fellows to consider some of the common issues that early stage researchers face. To help them to acquire the core skills and the knowledge required to plan and manage a research project and to explore approaches to managing time effectively.
Description
Key questions that should be asked by a researcher were addressed. Then, fellows were divided into groups to analyze the skills of an effective researcher.


Basics of Project Management were explained, including key questions, stages, tools for seeing “the big picture” and managing risks. Finally, planning tips were given together with advice for time management.


To share top presenting tips and to help researchers to consider, discuss and explore some of the skills involved in preparing an effective presentation and to meet the needs of different audiences.
Description
ESRs, divided in teams, analyzed what makes a presentation good and what makes them feel uncomfortable when presenting in front of an audience.
Aspects of the process of preparing a presentation were explained such as considering the audience, preparing audio/visual aids, scripts, practice, venue and equipment available, structure of slides, among others. Some tips were given for handling questions, controlling nerves and using appropriate language.
In order to demonstrate the importance of a shared context to deliver effective explanations, an exercise in pairs was carried out. One person was the ‘explainer’ and the other was the ‘listener’. Fellows sat back to back with the listener facing the back of the room. The ‘explainer’ was given a simple diagrammatic picture. The aim is to explain that picture in such a way that the ‘listener’ can reproduce the picture.


Team Activities
There were two types of team activities:
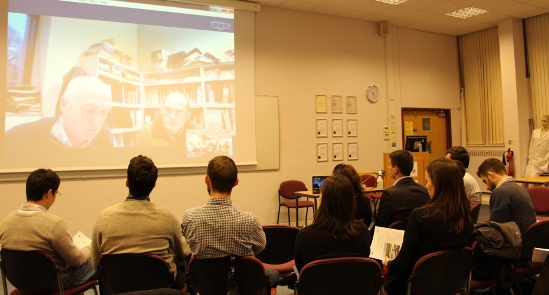
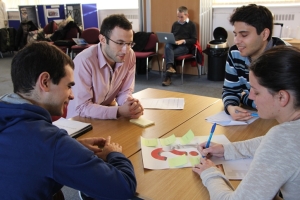
- Innovation workshop module consisting of working together in teams to solve a case study prepared by Professors Eugene OBrien (University College Dublin) and James Brownjohn (Full Scale Dynamics). The case study was provided on the Monday afternoon. The fellows were organised in teams to prepare a solution and present their proposal at the end of the week.
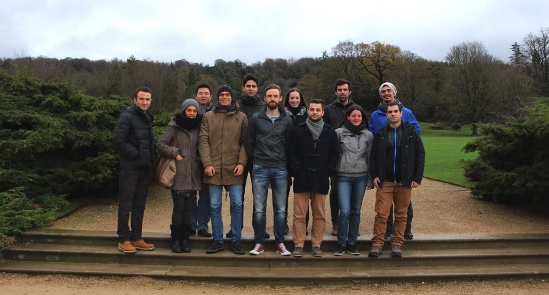
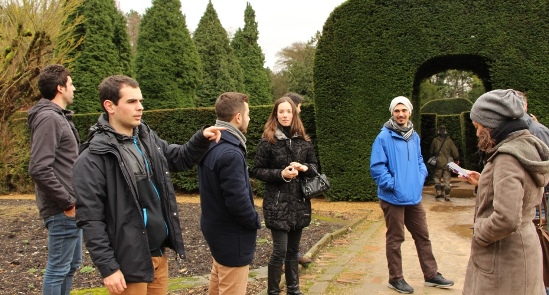
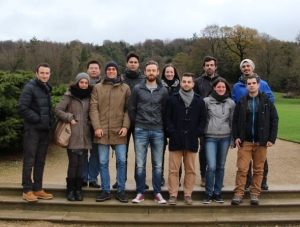
- A cultural visit organised by University of Nottingham, aimed to form powerful relationships supporting each other’s professional growth.
To promote team cohesion by facilitating ESRs a relaxing and informal environment where to know each other.
Description
The activity was held in Chatsworth House located in Bakewell, Derbyshire, United Kingdom. Fellows were accompanied by the Project Manager, Loreto Manriquez. The team activity held in Bakewell aimed to build relationships between ESRs that contributed to high team performance and cooperative learning in TRUSS.
There are different types of groups depending on their performance: pseudo-teams, working groups, potential teams, real teams and high-performance teams. In the working group, the individual contributions are added together without building on one another. In the pseudo-team, there are lots of team talk provided by the challenge or the impetus of an individual but proper organization is missing and performance is the poorest of all groups. In the potential team, there is not discipline or clear goals resulting in a performance similar to most of working groups. In the real team, all members share common goals, they have complementary skills and hold mutually accountable for their results. Finally, in the high performance team, members form powerful relationships with a very strong personal commitment to one another’s personal growth and development (source: Katzenbach, Jon R. 1993. The wisdom of teams: Creating the high-performance organization: Harvard Business Press).


The aim of this workshop is helping fellows to:
- Formulate solutions to open-ended problems in structural safety
- Learn to work as a team
- Develop an understanding of the principle mechanisms through which structures carry load and transfer loads through elements in to the ground and how to assess their safety
- Consider the wider social and environmental aspects and identify risks associated with their schemes
- Demonstrate effective presentation skills
Description
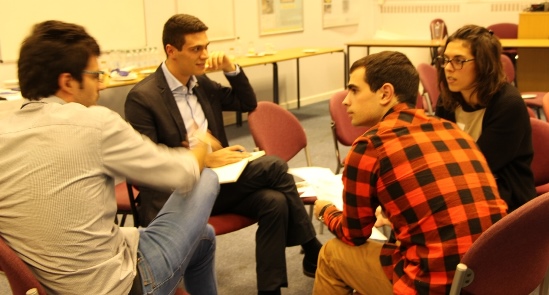
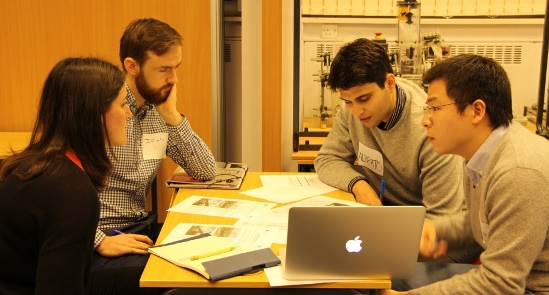
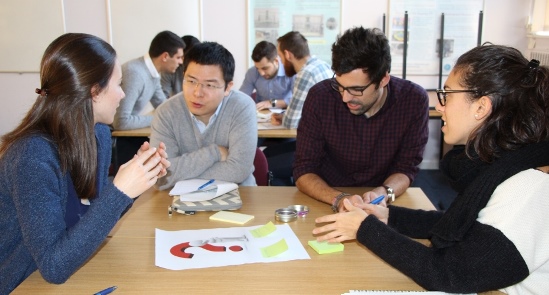
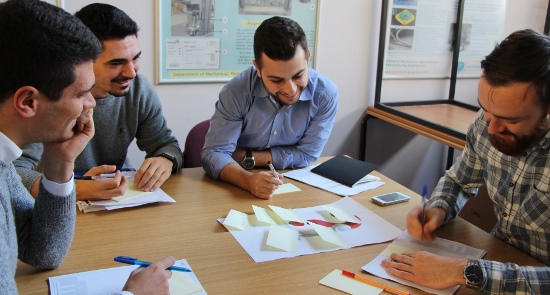
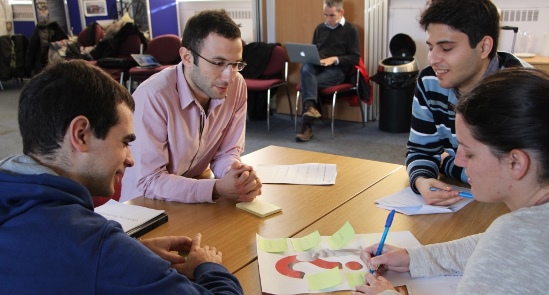
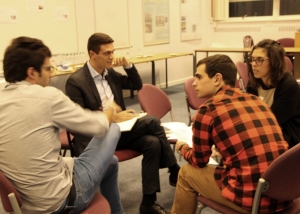
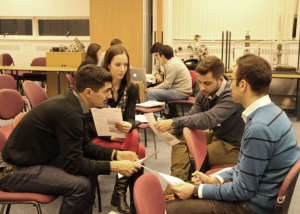
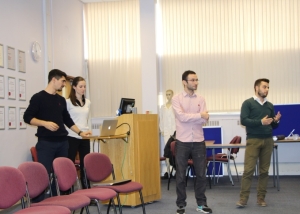
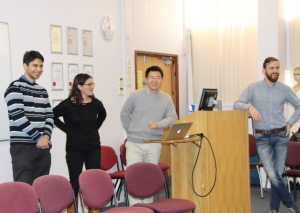
The case study problem simulates a situation where multi-disciplinary team work must be efficient to solve a real-world ill-conditioned problem. As part of the experience, fellows acknowledge the benefits of learning to work as a team. The format is that a brief is issued to the ESRs on Monday whereby three teams of ESRs (4 ESRs per team) compile their solutions during the week and present them to their peers and consortium experts on Friday in a “question and answers” type, interruptible presentation format. Prof OBrien was available on the Monday afternoon to introduce the case study and answer any queries via video call. Time was allocated during the week (Wednesday afternoon and Thursday from 11 to 5 pm) to facilitate team work towards the solution. Prior to the training week, ESRs had been introduced to google collaborative tools, so they could build this presentation working together and simultaneously using google slides during the week.
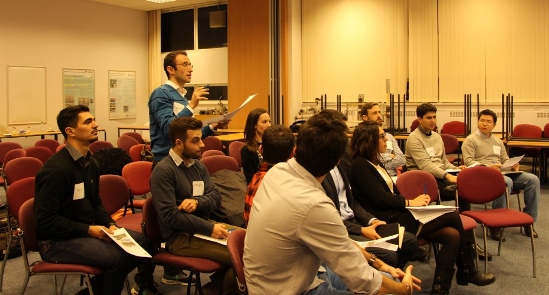
They finally presented their solutions on Friday afternoon. Presentations were in an interruptible forum with participation of all team members, and the presentation material had to contain sufficient information to fully justify their decisions. Overly complex visual aids (animation, etc.) were to be avoided – this was an interactive discussion/critique of what fellows are proposing and of the judges’ opinions of the merits and shortcomings of the proposed solutions. Each team had about 30 minutes each including questions by Professors OBrien and Brownjohn who acted as judges in an “X-factor” style. Finally, a team was appointed as winner, and Prof Brownjohn, who had been involved in the monitoring of the bridge subject of the case study, explained what really happened and the solution adopted in practise.
The teams were selected to include at least one fellow with specific knowledge on the problem in hand, to be sufficiently large to provide sufficient pool of knowledge, experience and views to promote the active participation of all team members, but small enough to prevent inhibition of active participation of everyone. They were also chosen to be as heterogeneous and diverse as possible to facilitate interaction, group learning, achievement, team role allocation and mutual beneficial across abilities. The composition of the three teams was as follows:
| Team 1 | Team 2 | Team 3 |
| Giulia Milana | Sofia Antonopoulou | Barbara Heitner |
| Matteo Vagnoli | Federico Perrotta | JJ Moughty |
| Daniel Martinez Otero | António Barrias | Siyuan Chen |
| Rui Teixeira | Farhad Huseynov | Alberto González Merino |

Given the nature of the learning which is required in this workshop (application rather than acquisition), the problem is well-defined following the usual problem based learning definition. It is relatively open-ended and based on a realistic project to encourage diversification and contribute to a real-world feel. The brief on the case study specified that:
This is a major bridge in a bottleneck location that is scheduled to be replaced in 10 years’ time. It has deteriorated and the client is concerned about its safety in the interim period until it is replaced. Your brief is to advise the client on the following:
- Specify a series of tests to assist in establishing the safety of the bridge
- Recommend a programme of analyses/studies and
- Propose a system of sensors for ongoing monitoring.
- All of this should take account of the client’s ‘tight’ budgetary situation and keep costs at a sensible level.
Together with the brief, fellows were provided with links to a wealth of information containing reports, papers, drawings and photos published about the bridge.
While traditional teaching tell students what to learn, the principle behind the case study proposed here is to let students identify what to learn by introducing them a problem first, and then let them work towards the understanding of its resolution. Such an approach allows developing specialist knowledge and key transferable skills for work and social life, i.e., students are able to adapt more easily to changeable scenarios than with a traditional learning method where the learning material is explicitly provided to the student via lectures. Peer and deep learning is also promoted (knowledge is constructed by independent study and discussion with peers). It must be noted that is not only problem solving capacities that are enhanced, but also communication skills and interpersonal skills. This way, students get prepared for lifelong learning deemed to be essential in an era of continuous technological changes and access to practically unlimited sources of information. Even more, because the concepts are learnt by the student as a discovery, the retention rate will be significantly higher than when it is verbally transmitted by a lecturer.
Research Seminars
Objective
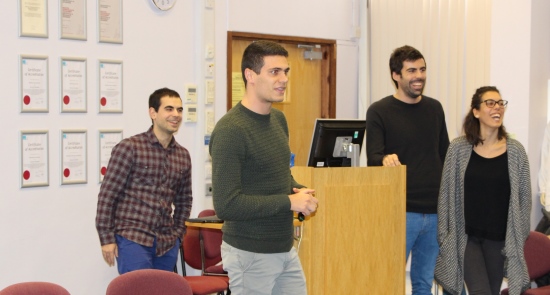
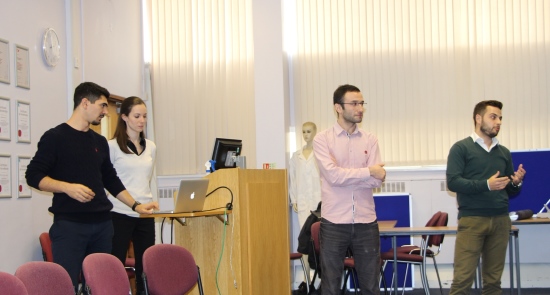
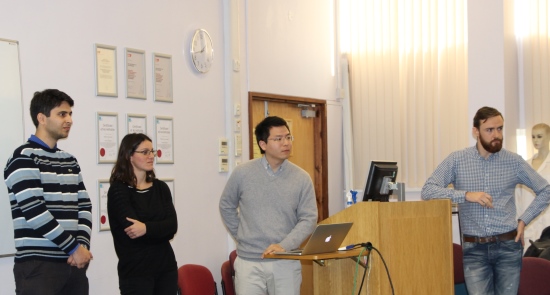
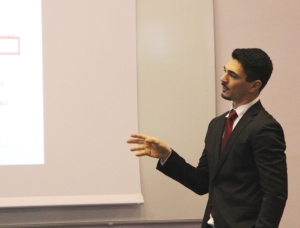
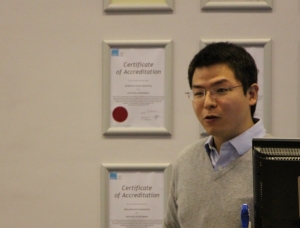
To prepare ESRs to present their own work at other national and international events. Interactive presentations by each ESR on his/her research project were followed by face-to-face doctoral studies panel meetings that provided feedback from the consortium for Research and Personal Career development plans.
Description
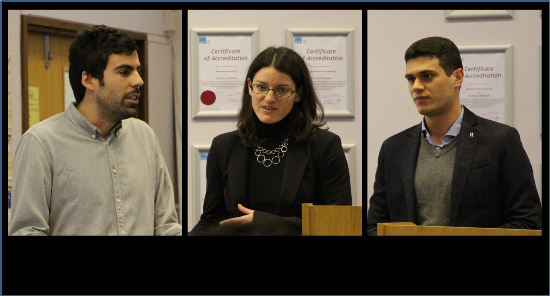
In these research seminars, presentations are confined to TRUSS partners and researchers local to the host venue who wished to attend. At the first training week, the theme of each presentation was mostly around the research plan and literature review to date. After presentations, each ESR was called on an individual basis for face-to-face meetings with his/her Doctoral Studies Panel to discuss the Personal Career Development Plan.

ESR Feedback
At the end of the training week, answers to a confidential questionnaire were gathered from fellows to identify those modules found more useful for the project and for their future career and to propose new modules to cover their needs or a follow-up to existing ones in a future training event.
Click the image below to see the schedule